Hi QAVVERS,
It was great to read out some of our members’ outstanding FY26 results on the AU show this week! Keep them coming in!
As weeks go, this one was… choppy? The US/Iran truce is apparently over for the time being, although the Hormuz monitor says 34 ships are currently transiting, which is the highest number I’ve seen since the war started in February. Oil prices have spiked again though. So try to figure that one out. I think crude oil is back to being a buy. Unfortunately the AU market has been so choppy that it’s been difficult for us to buy oil stocks. The U.S. market is different, but we’ve got plenty of buying opportunities over there, as usual.
As usual, we just keep playing it day by day, obeying our rules, and not getting too caught up in the noise.
Let’s get into the details!
AUSTRALIAN MARKET UPDATE
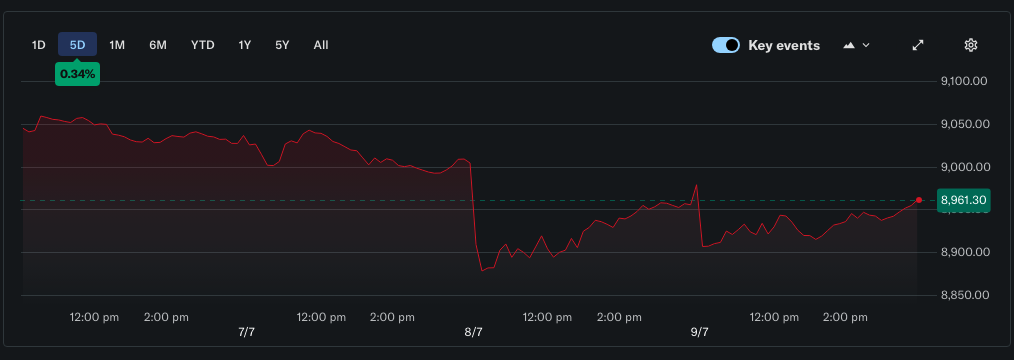
The All Ordinaries finished the 5-day period little changed, with the index sitting around 8,910 and the prior completed week (to 4 July) showing the ASX 200 up around 0.9%:
-
The Australian sharemarket extended its losing streak to a fourth straight session on Thursday as escalating Middle East tensions weighed on sentiment, with the ASX 200 falling to 8,762.50 and slipping below its 200-day moving average.
-
Australia’s trade balance swung from a $1.4 billion surplus to a $3.0 billion deficit in May, driven by a sharp fall in exports including a 35% drop in non-monetary gold exports, along with softer LNG volumes and lower commodity prices.
-
Locally, elevated borrowing costs, a cooling housing market and geopolitical uncertainty continued to weigh, with the ASX 200 losing ground across four consecutive sessions this week as broad sectoral pressure hit materials, technology, communication services and financials.
US MARKET UPDATE
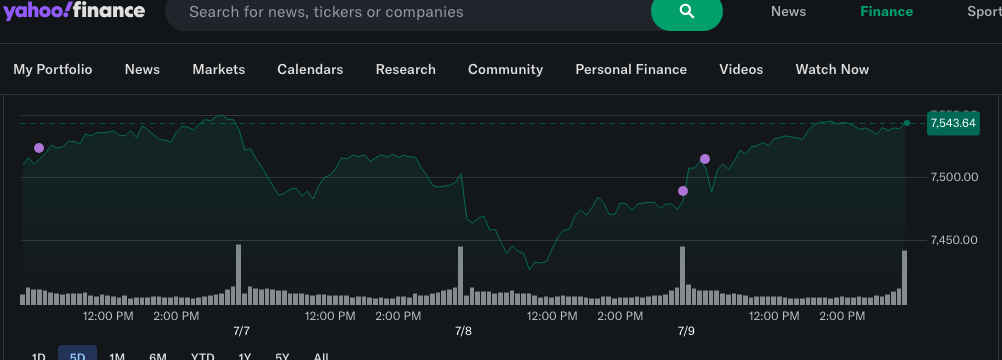
The S&P 500 ended Thursday July 9 at 7,543.64, up roughly 0.8% from the prior week’s close of 7,483.24, amid a volatile stretch driven by geopolitics and a semiconductor rotation:
-
Stocks recovered on Thursday, lifted by a jump in semiconductors and a pullback in oil prices, with the S&P 500 rising 0.81% to close at 7,543.64 and the Nasdaq gaining 1.30% to 26,206.89, as markets tried to stabilize despite ongoing US-Iran tensions.
-
Oil spiked sharply mid-week after Iran attacked a Qatari LNG tanker near the Strait of Hormuz, which typically handles around 20% of global oil traffic; Brent settled 3% higher at $74.16 per barrel and WTI advanced 2.8% to $70.44 on Tuesday.
-
Treasury yields rose after President Trump declared the ceasefire with Iran was “over,” and the move was compounded by minutes from the Fed’s June meeting, which showed some policymakers saw a case for further rate hikes if inflation remains elevated.
-
Weekly jobless claims came in at a seasonally adjusted 215,000 for the week ended July 4, down 4,000 from the prior period and below the Dow Jones consensus estimate of 218,000, the lowest total since May 23.
So, let’s get into my weekly updates and see where we are at.
All the Best,
Cam
QAV MYTH KILLERS
You Don’t Get Dealt Blackjack Every Hand
Our new marketing tagline is “Systematic Outperformance.” Tony came up with it last week and I love it. Apparently he’s not just a pretty face. But he also said something else on the podcast this week that’s worth drilling down on.
When it comes to investing, the mistake I think a lot of us make is thinking like this: if a strategy actually beats the market, it should beat the market every year. And if it has a flat year, or a bad year, then something must be broken. Time to change it, tinker with it, or bail out and go back to tips from the bloke at the barbecue or that seminar I saw advertised on Facebook.
That’s human nature. We want the graph to always go up and to the right in a nice smooth line, every quarter, forever and ever, amen. And the whole finance industry feeds the fantasy, because “consistent outperformance” sells a lot better than the truth.
Here’s the truth. Outperformance is lumpy.
Maybe “Lumpy Outperformance” is even better than “Systematic”, but it probably isn’t as marketable. Anyway, I digress.
Let me show you what I mean with our own numbers, because we publish them and you can check them on our website.
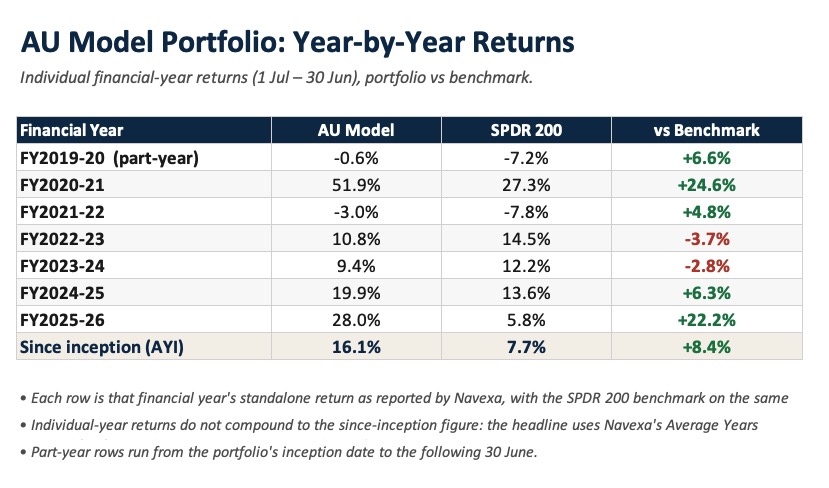
The QAV AU Model Portfolio (formerly known as the Dummy Portfolio) has been running since April 2019. Over those seven financial years it’s returned about 16.1% a year, against the SPDR ASX 200’s 7.7%. Better than double the market. That’s the “Systematic Outperformance” the tagline is talking about, and it’s real and it’s verifiable.
But look under the bonnet and it’s anything but smooth.
Take FY2022-23 and FY2023-24. The index ran 14.5%, then 12.2%. We did 10.8%, then 9.4%. Two years running we didn’t just have a boring year – we lost to the market. By 3.7 points, then 2.8. Two straight years following the exact same rules that had thrashed the index the year before and would thrash it again the year after. That is what lumpy looks like, and it does not feel like a system working. It feels like a system broken.
If you’d thrown in the towel at the end of that second losing year – and plenty did – you’d have walked away right before FY2025-26, when the Model Portfolio did 28% against the market’s 5.8%.
That’s what most years look like. A little bit in front. Sometimes a little bit behind. And then, every few years, the market hands you a blackjack.
This financial year just gone was one of the good hands. The seven gods were good to us this year (yes, I’m watching House Of The Dragon). Members have been emailing their FY26 results and some of them are ridiculous. Jim up 74.5%. Scott up 26.6%. Daryl up around 34% and his win-loss ratio jumped from 55/45 to 70/30. Tony rolled off 17.5% against an STW that did about 5.8%, so nearly triple market. These are not average years. These are the fish you catch once every few seasons.
The mistake is thinking those years are the normal ones and the flat years are the failures. They aren’t failures, they are the normal years.
My favourite example is Ed. Ed’s been with us since the dark ages and he wrote in this week with the first genuinely happy email I’ve had from him in years. His run: down 4.5%, then up 8.3%, then up 3.7%, then up 13.3%, then up 15.5% this year. Look at those first three numbers. Years of just keeping pace, or worse. If Ed had quit after year three – and plenty of people did – he’d have locked in the mediocre part and missed the part that made it all worthwhile. As he put it, it’s easy to stay faithful when everything’s green. It’s hard when it goes red and Rule 1 keeps triggering week after week.
As TK said on the show: You don’t get dealt blackjack every hand. You can’t sit out the boring cards and stroll back to the table only for the good one. You have to play every hand the way the rules tell you to, so that you’re still sitting there when the good one comes. The system Tony designed stops us from losing capital during those years. It keeps us at the table, patiently playing hands, waiting for vingt-et-un. Because you never know when the blackjack year is going to start.
And that’s something most of the professional investors can’t do, and it’s our edge.
According to SPIVA’s Australia scorecard for the year ended December 2025, 74% of active Australian equity funds underperformed the ASX 200 that year. Over the full decade, a solid majority underperformed in every category. Get paid a fortune to trail the index. Nice work if you can get it.
Part of the reason is structural, and it’s the same lumpiness we’re talking about. When a fund has a flat or down year, its investors panic and pull their money out. The manager is forced to sell into weakness to fund the redemptions – and, as Tony points out, the down year is very often the year right before the big one. They get liquidated out of their own recovery.
You don’t have that problem. You can sit through the average years and be there for the blackjack. But you’ve gotta have the cojones to stick it out.
So when we say “Systematic Outperformance,” don’t read it as “we beat the market every single year.” Read it as this: follow the rules through the boring hands, and the math compounds to roughly double the market over time.
The system doesn’t promise you a good hand every deal. It promises that if you keep playing the way the rules tell you to, you’ll still be sitting at the table when the good hands come around.
STOCK ANALYSIS OF THE WEEK
In the AU portfolios, we had to trade a bit this week. I sold TLS and SRV, and bought MSV. Hard to find things to buy, nearly everything was having a down day when I looked.
In the U.S. portfolios, I sold AERO, and bought FG.
Tony did a Pulled Pork on New Murchison Gold (NMG), a penny-stock gold miner in WA that went from zero to profitable in under a year by avoiding the cost of building its own processing plant. Full details in the podcast link below.
On the American podcast this week, I did a pulled pork on FG. The podcast link is down below if you want the full analysis.
BUY LIST
Each week, we produce a buy list based on our value investing system that we share with our QAV Club members. The intended primary purpose of this buy list is for club members to use as a reference for comparing their own buy list. In theory, all of our buy lists should look pretty similar each week.
AUSTRALIAN BUY LIST
QAV Value Investing Buy List (AU) 2026-07-05
U.S. BUY LIST
QAV Value Investing Buy List 2026-07-06
PORTFOLIO PERFORMANCE
We compare our performance to what we think is the most relevant benchmark (SPDR 200 in Australia, S&P500 in the USA), but if you’re new to investing, these comparisons might not mean much. Instead, you can compare our performance to the top-performing Super Funds in Australia and see why an amateur active investor (who has a system to follow) can out-perform most of the “professionals”.
We publish a fresh performance snapshot once a month. Weekly noise doesn’t tell you much in a value-investing system — what matters is the trend.
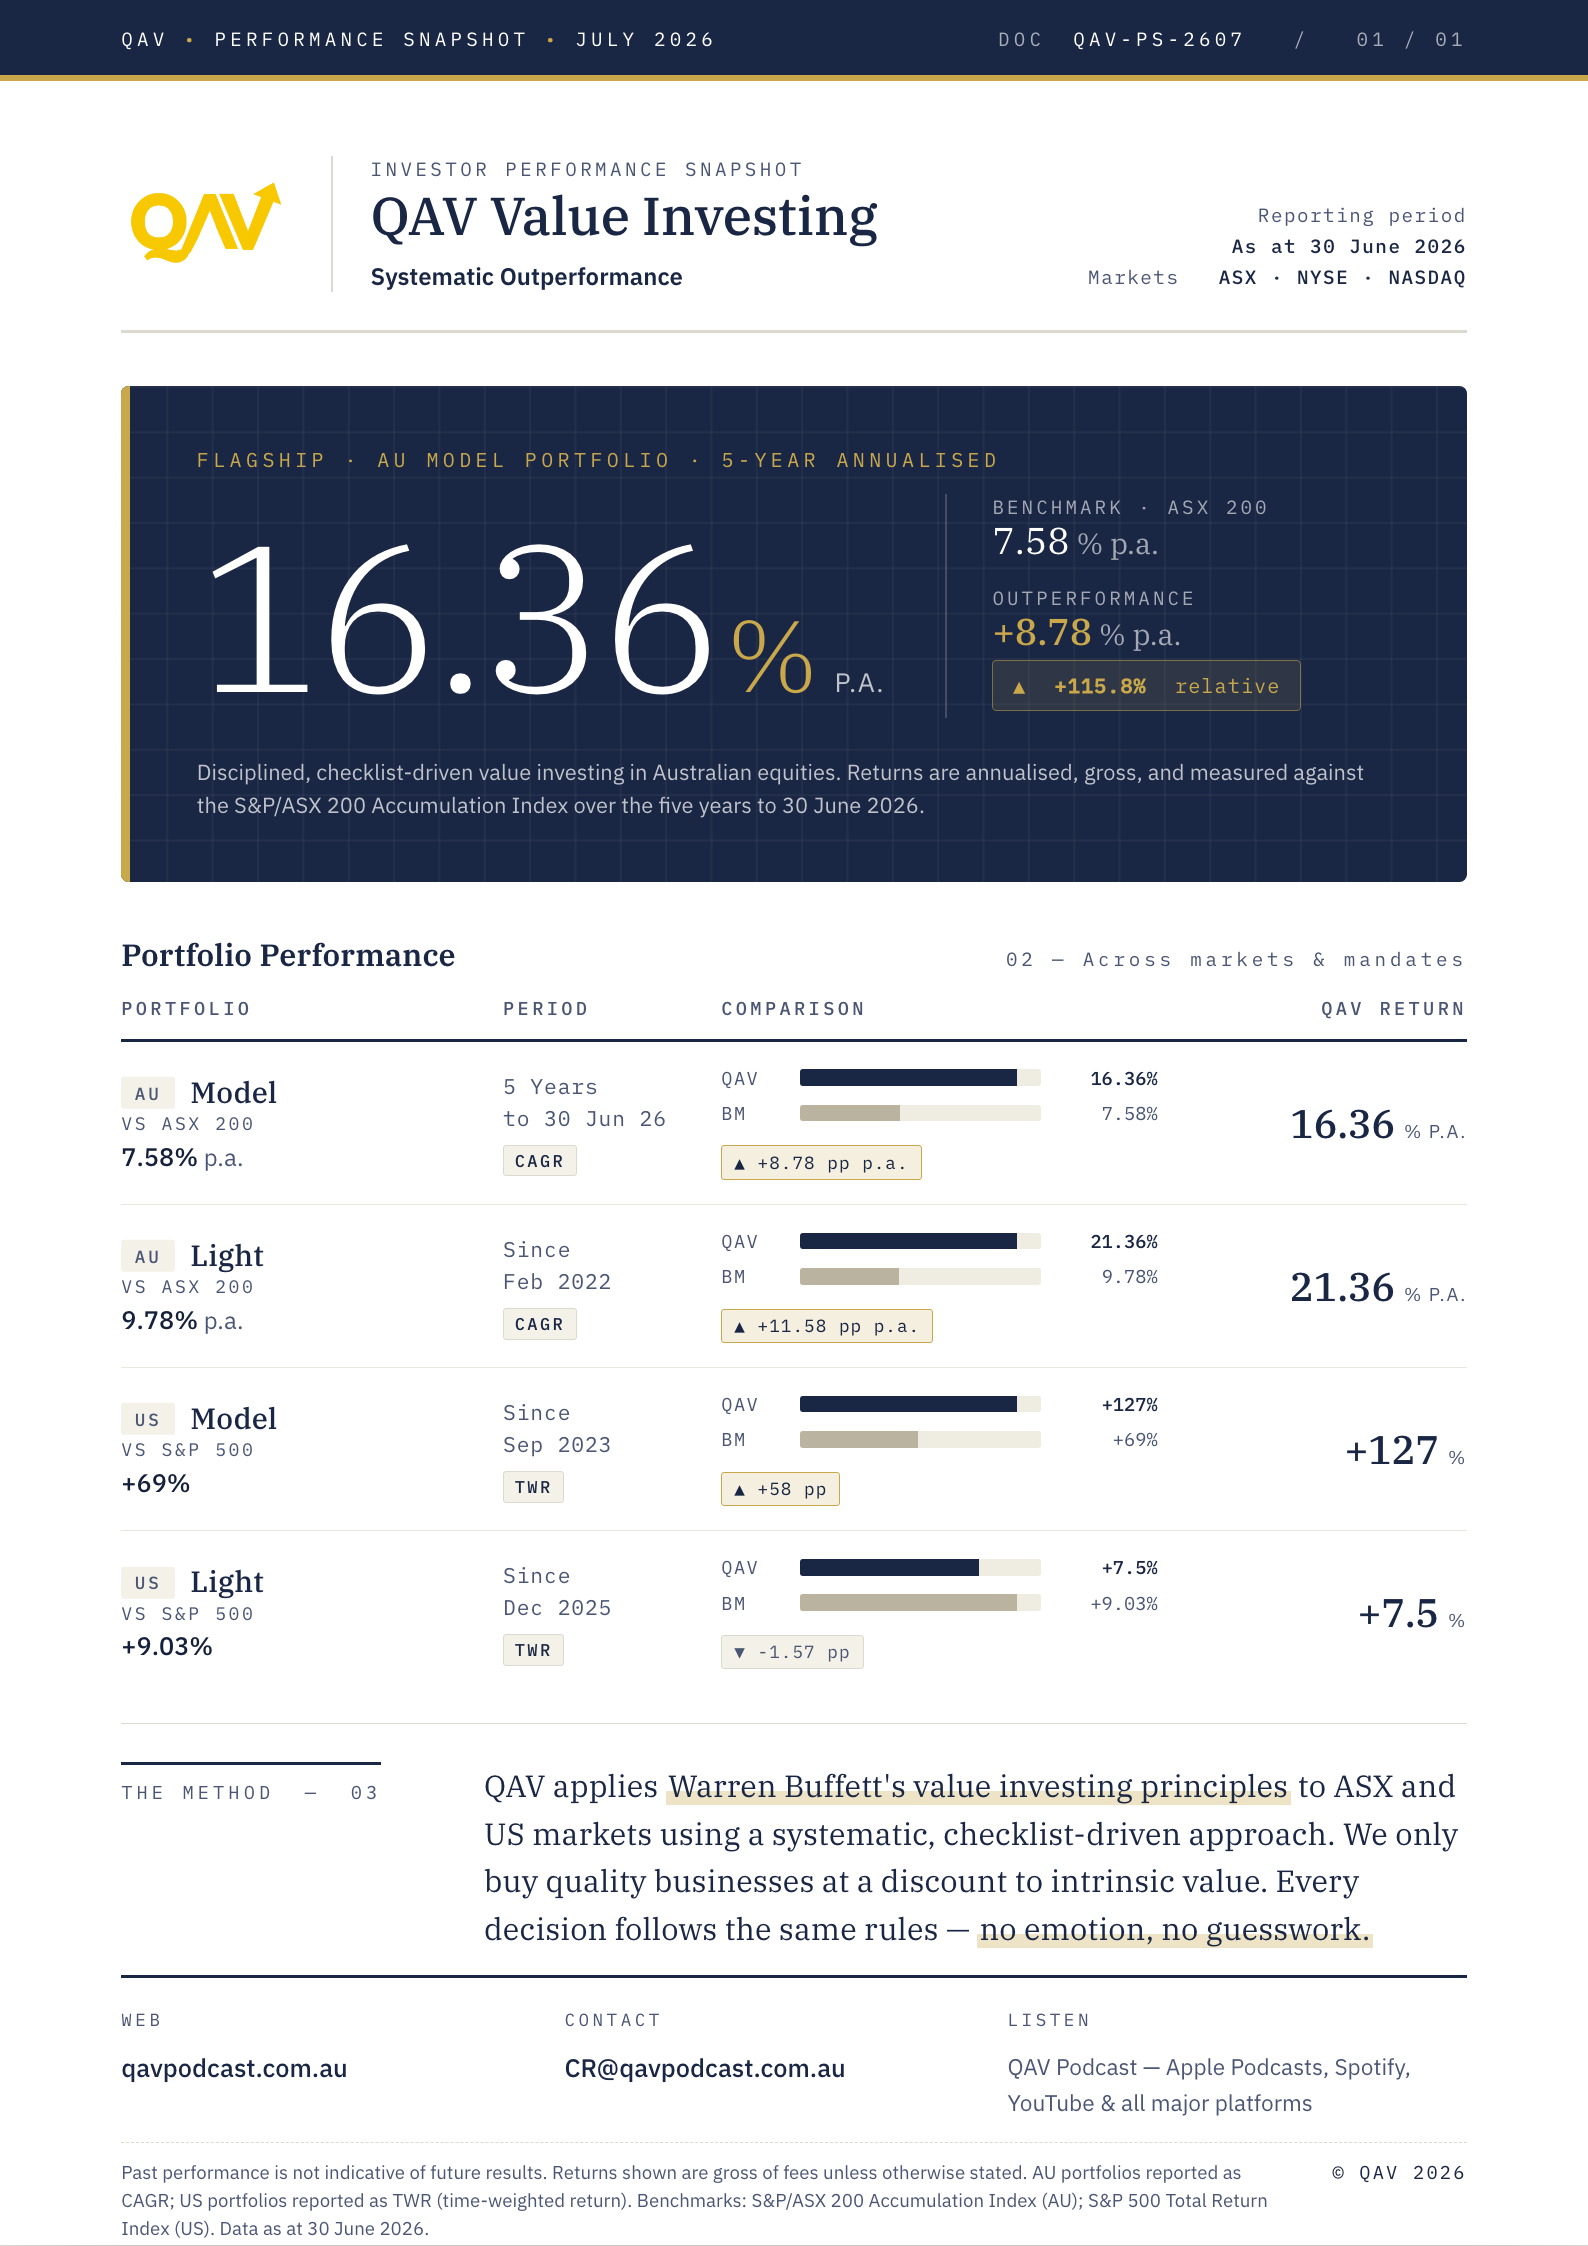
July 2026 performance snapshot.
Become a QAV Light Member today and start your investing on the right track
If you want to find out what we’re trading in QAV Light each week, sign up to become a member. You’ll get an email from me every Monday letting you know what we’re buying and selling in that portfolio. You can choose to copy our trades or not. It’s the easiest way to start your rules-based investing career… and you don’t even need to know the rules. I’ll follow the rules for you. It’s a good first step to eventually becoming a QAV Club member and learning how to run the system by yourself.
QAV LIGHT: Same destination. You choose where you sit.

(Note: Americans interested in joining QAV Light or Club please go here instead.)
Add QAV America — US stocks, the same QAV method
Already a QAV member? You can add QAV America as your second membership at 50% off — US-listed stocks, the same QAV approach, billed in AUD through this site (just one payment to keep an eye on). Add QAV America →
Not a QAV member yet? Join QAV first, then you can add QAV America at the 50% member rate.
THIS WEEK’S EPISODES
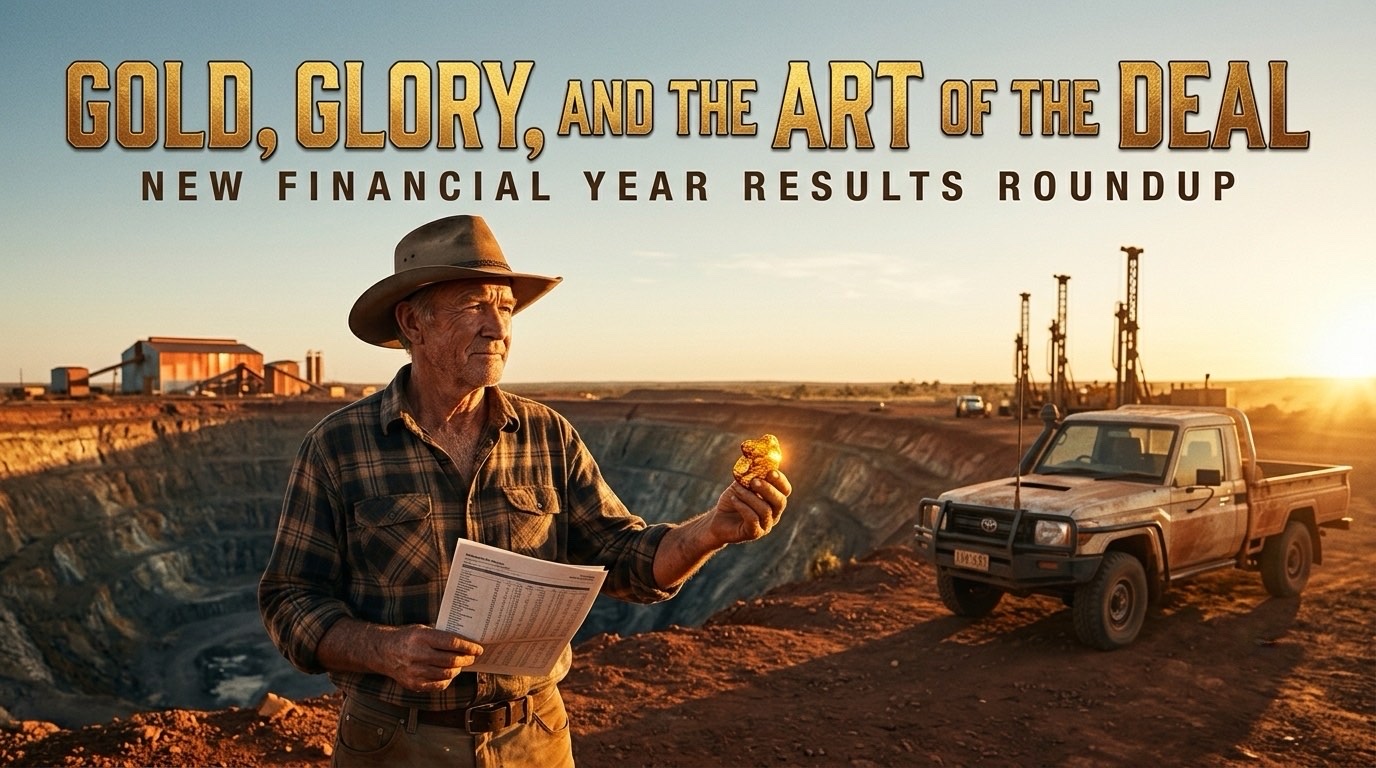
Gold, Glory, and the Art of the Deal: New Financial Year Results Roundup: QAV AU #927
Guaranteed Returns (FG): QAV America #60
STOCK NEWS AND UPDATES
COMMODITIES
This week the big changes to commodities were the following:
| Commodity | Status |
|---|---|
| Gold (USD) | BUY |
| Coal (thermal) | JOSEPHINE |
| Coal (coking) | BUY |
| Platinum | BUY |
| Aluminium | BUY |
| Magnesium | BUY |
| Manganese | JOSEPHINE |
| Wheat | JOSEPHINE |
| Lithium | BUY |
And Crude Oil as become a buy too.
DISCLOSURE
Please review our trading and disclosure policy.
SIGNING OFF
That’s the lot for this week. Happy hunting! And keep sending us your FY26 results!
SSDD!
- Cam
That’s it for the week!
QAV A GOOD SHAREMARKET!
Got a question? info@qavamerica.com
Leave a Reply